What is MQ Audit Logger by TxMQ?
MQ Audit Logger is an IBM MQ auditing and observability solution that records every MQ API (MQI) operation, providing real-time and historical visibility into application activity. Built on IBM MQ Activity Trace with Grafana and Loki, it enables administrators to quickly troubleshoot issues, analyze application behavior, and investigate message activity long after events occur.
MQ Audit Logger records every IBM MQ API operation, including:
- Connect/Disconnect
- Open/Close
- Put/Get
- Commit/Rollback


Each audit record can include:
- Queue Manager
- Queue Name
- Application Name
- User ID
- Client IP Address
- Timestamp
- Message Properties
This creates a complete audit trail that enables administrators to trace message flow, identify application behavior, and quickly diagnose production issues.
Key Features of MQ Audit Logger by TxMQ
- Complete MQ Auditing – Capture every IBM MQ operation with full transaction details.
- Historical Search – Investigate activity from minutes to months ago.
- Grafana Dashboards – Visualize application activity, connections, usage, and errors.
- Deep Search – Find transactions using business IDs with optional message payloads.
- Lightweight Design – Comprehensive visibility with minimal performance impact.
- Configurable Alerts – Send notifications via email, Slack, SMS, or webhooks.

Common Use Cases – Missing Messages
What do you do when the Finance department tells you they are missing sales totals for the month, end and the Sales team vows their applications are running perfectly and the data was sent? You check the queue and it’s empty. How can you validate it’s not a middleware issue?
The MQ Audit Logger records every operation. Use Dashboards or the Log file drill down to find the related messages and applications

Common Use Cases – MQ Performance
You notice performance issues from in-house or 3rd party applications. Source code is not available and/or the development teams are not able to assist.
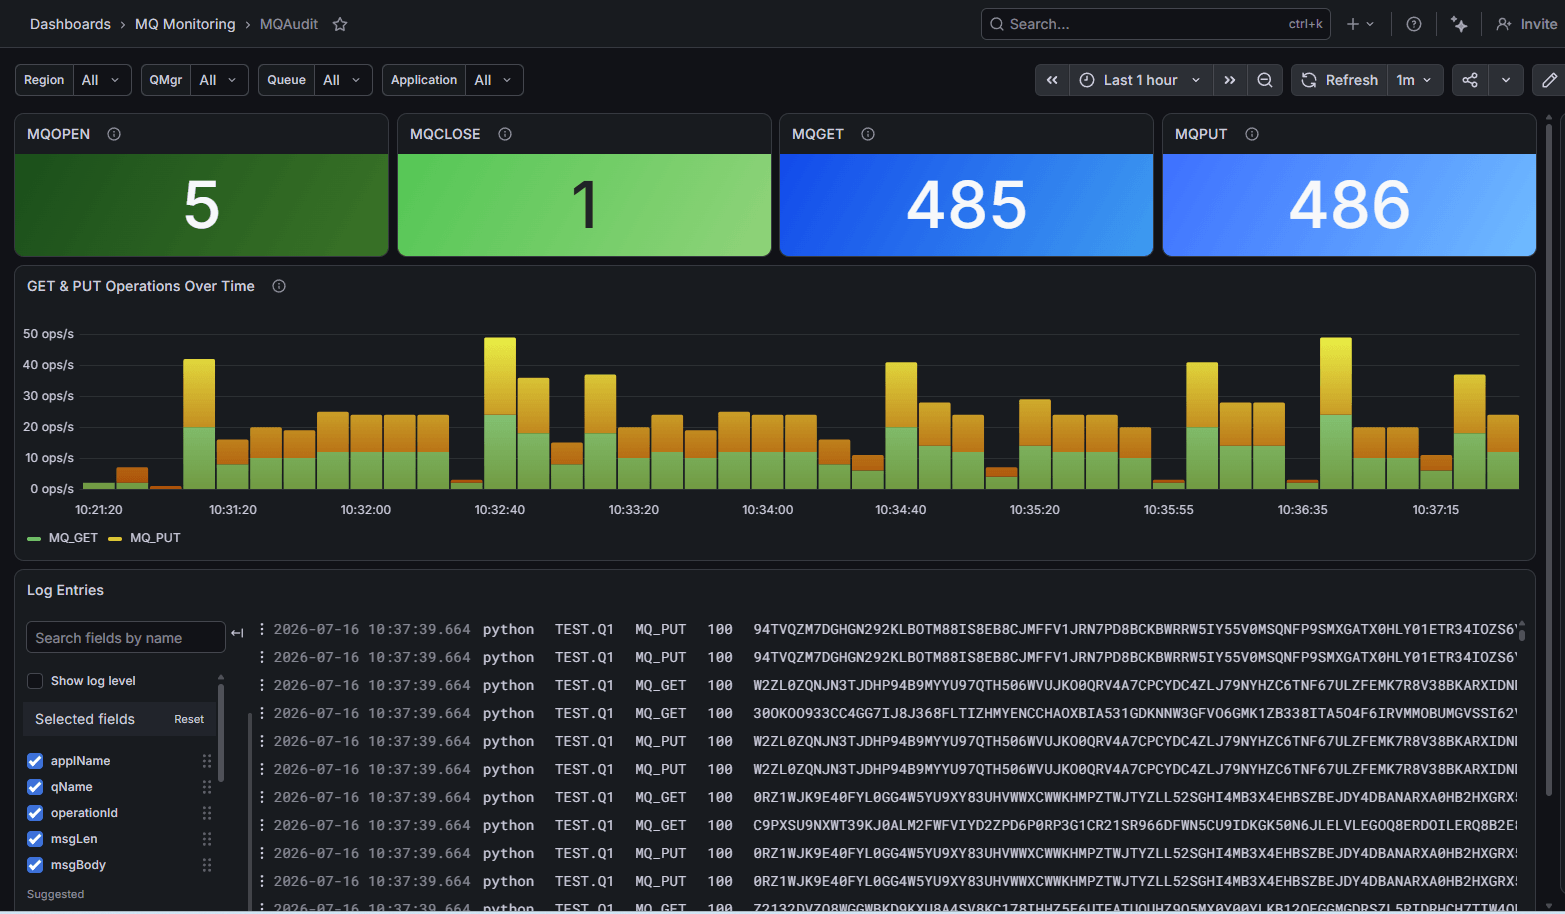
While most performance tools will show you resource utilization, they will not show you what the application is doing. Using the Dashboard or Log file drill down to get visibility in the applications API call.
In this sample the Python application is performing Connect, Open, Put, Close, Disconnect inside a loop. A very inefficient program style.

Common Use Cases – Unreliable Applications
Business units are reporting unreliable or odd application behavior. The application logs do not show any relevant information on why.
Not only does the MQ Audit Logger record every MQI call, it can be configured to also record the completion status. Its possible applications are not trapping and handling MQ exceptions. This can lead to lost messages and erratic behavior.

MQ Audit Logger is Ideal For:
- IBM MQ Administrators
- Middleware & Integration Teams
- Application Support & DevOps
- Operations (NOC) Teams
- Organizations in Financial Services, Healthcare, Manufacturing, Retail, and Logistics