National product-transport-logistics company (client) sought WebSphere Z/OS environment performance assessment and analysis to solve memory issues.
The client experienced CPU spikes and service timeouts that caused application-hang conditions with a need to recycle the WAS app servers. The workload volume approached peak for the business process, with the need to address JVM configuration and settings changes to potentially alleviate CPU spikes.
Statement Of The Problem: The cause of the client’s WebSphere issue was within one of the WebSphere Servant Regions. The region was running out of memory and performing a large volume of garbage collection – so much that this WebSphere region took over most of the z/AAP capacity. The question was: How could the client control this activity with WLM?
TxMQ performed an analysis using the following tools:
- Z/OS RMF reports
- Javacore analysis using the IBM Support Assistant Workbench (ISAW)
- WebSphere GC logs analysis using the ISAW
TxMQ logged the following observations:
- The WebSphere infrastructure was remarkably well-maintained and well-tuned for the hardware environment. In addition, TxMQ was impressed by the client’s knowledge base.
- The environment was not technically restrained – it could do what the client “wanted it to do.” Instead, lack of hardware and application design were of issue.
- The Z/OS infrastructure was problematic. The main issue: What does one do when the z/AAP goes away?
- The situation pointed to an application-design issue. All tests pointed to a condition whereby the application was attempting to do too much, based upon less-than-optimal design and execution.
Following is a summary of notes from the Javacore analysis:
- Number of threads allocated to ORB should be investigated
- Recommended: Xmxcl setting (only for IBM Java 5.0, up to and including
- Service Refresh 4)
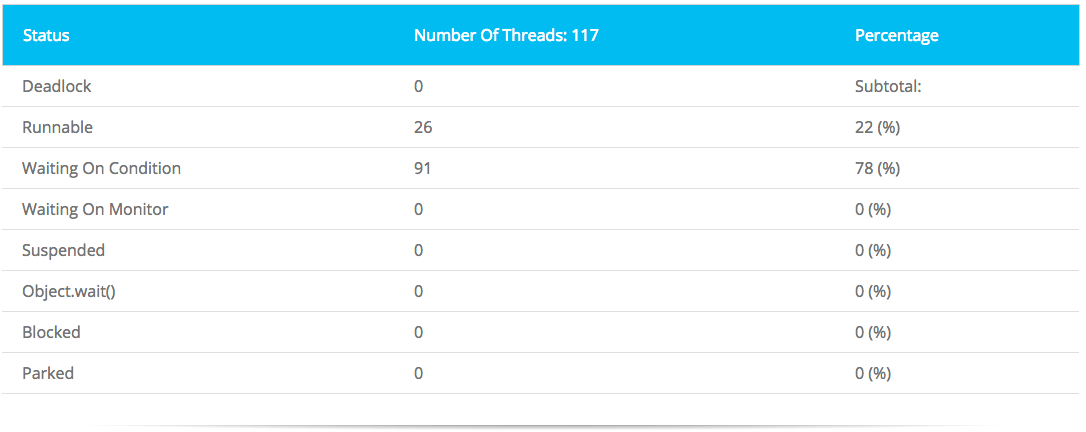
- Thread-status analysis: Noticed 26 threads were actually running. Code pointed to ORB, EJBs
- No one was waiting on a monitor, yet there were 91 waiters. It appeared the code was not doing the same thing on the other threads. (A monitor is how java keeps code reusable and allows resource sharing.)
ORB thread pool stack: Almost all the running threads look like this:
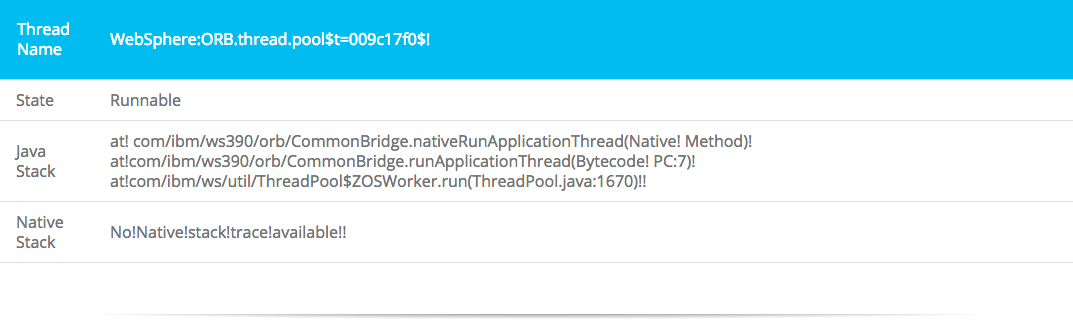
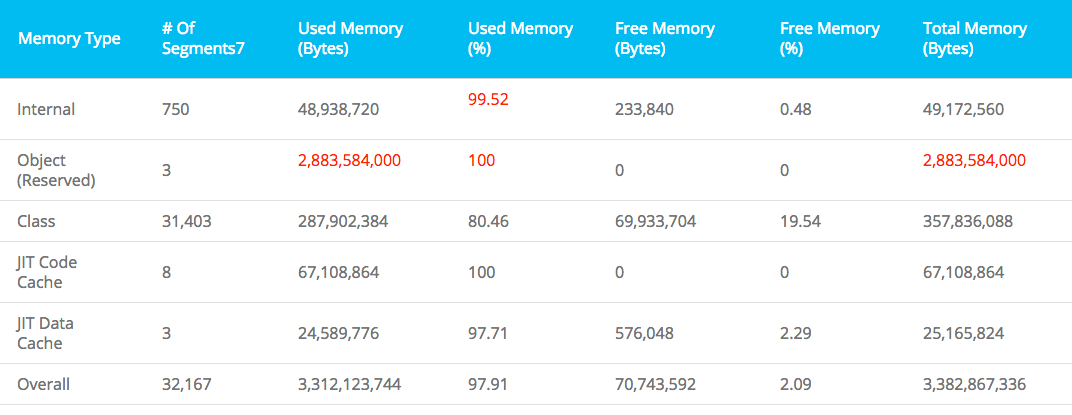
This analysis showed the JVM to be running out of memory.
At the conclusion of the review, TxMQ discussed recommendations with the client, but the client remained concerned that the recommendations still did not address the issue of CPU overload. Some results from that conversation:
- The client’s applications team decided to support a move to WASv7.x with the expectation of increased performance.
- WLM management is an area that needs review, but any modifications (re: priority levels for WebSphere) are problematic.
- The additional zAAP is preventing a system heart attack. The general-processor/zAPP costs must be accounted for before the zAPP expired in the next 6 weeks.
- Best value-for-spend would be an application-review of the heap usage.
Client takeaway from performance review:
- Add more ORB threads
- Add more memory to the JVMs
- Look into JVM –Xmxcl setting
- Investigate how EJBs are using connection pools
- Get the GP and keep the zAAP
- Set GC-threads limitation on the WebSphere JVM to avoid the taking of all CPUs
when doing GC - Profile the application and tune it with the view of system resources, parsing
and messaging - Investigate DataPower appliance as a method of offloading Soap services, XML parsing and messaging
- Choose a DB Subject Matter Expert to look over the design, tuning and capacity-planning of the subsystem.
Photo courtesy of Flickr contributor xdxd_vs_xdxd